Before you start graphing, its helpful to make a table for cosine since its the exact opposite of secant.
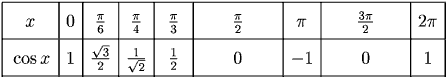
With that in mind, the first step to graphing a secant is to lightly graph the cosine function with the points from the table as seen in the dotted line. Then draw vertical asymptotes where the cosine graph is zero; take in mind the minimum and maximum points. Once you're done with that, you fill in the graph by taking the maximum point and curving it into an upward parabola and taking the minimum point and curving it into a downward parabola. In these graphs, also remember that the graphs don't touch or cross the asymptotes.

